A SVM from Scratch-Part2
Discovery consists of seeing what everybody has seen and thinking what nobody has thought. – Albert Szent-Györgyi
Going to high dimensional spaces
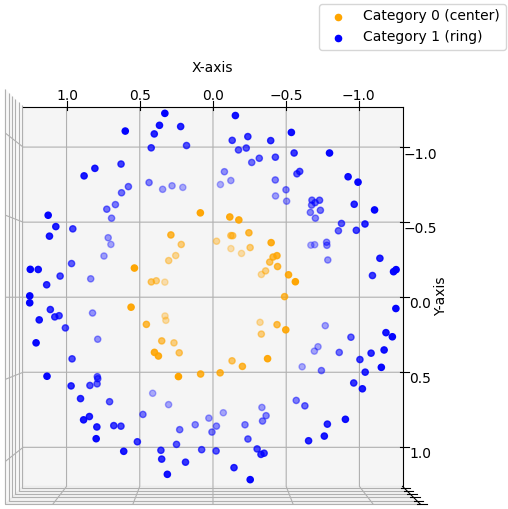
Before diving into the specifics of non-linear Support Vector Machines (SVMs), let's first outline the key idea that underpins this entire post. It’s clear that data points with $n$ features may not always be perfectly separable by a simple line or plane. For simplicity, let's assume we are working with 2D input data ($x_1$ and $x_2$) that we wish to classify. When the data points are arranged as shown in the figure below, it's evident that no straight line can effectively separate the two categories.
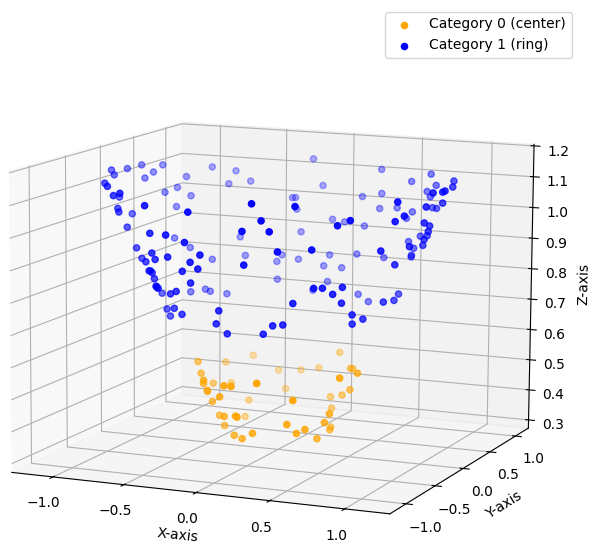
This illustrates the challenge: no linear decision boundary exists to distinguish the data. The solution proposed by SVMs is to project the data into a higher-dimensional space by adding new features to each data point. While feature engineering—manually crafting new features—is often a critical aspect of data science, in the context of SVMs, we don’t create entirely new features. Instead, we combine the existing ones in clever ways. In our example, we would take each 2D feature vector and add a new component: $x_3 = x_1^2 + x_2^2$. We thereby mapped our 2D data into a higher dimensional space 3D. If we now plot the enhanced data, we get this:\

$$
\begin{equation}
L = min \left( \frac{1}{2} ||w||^2 \right)
\end{equation}
$$
under the constraint that:
$$
\begin{equation}
y_i (\mathbf{w} \mathbf{x_i} - b) \geq 1
\end{equation}
$$
Ok so why don't we just go ahead take our n-dimensional data points transform them into p-dimensional feature vectors and solve eq. 1 using some off the shelve algorithm? Well as mentioned above $p$ can easily become very large making the solution of the problem computationally expensive. Eq. 1 is quadratic but the constraints of eq. 2 are linear. This is a classic Quadratic Programming (QP) problem, which requires us to solve a system of equations. The bottleneck of QP solvers is to invert a (p+1) x (p+1) matrix, which has a time complexity of: $O((p+1)^3)$. For smaller models this still remains doable but the process becomes prohibitevly more expensive as the complexity of the problem increases, and hence more dimensions are required. Fortunately, mathematicians have devised a far more efficient solution to solve the problem...
Finding the dual problem
In part 1 of this post, we introduced slack variables and the hinge loss function in order to incorporate the constraint given by eq. 2 into the cost function eq. 1 This time we will follow a different approach. What we realy want is to minimize L, under the constraint given by eq. 2. In 1788 Lagrange found a mathematical formalism to find extreme points of a function under certain constraints, called Lagrange Multipliers. The method allows us to transforms a constrained optimization problem into a form that can be solved using calculus, specifically by introducing auxiliary variables (the multipliers). It works by constructing a new function which consists of the function we wish to minimize and subtract from it the constraint function times the Lagrange Multiplier often called $\alpha$:$$
\begin{equation}
\mathcal{L} = \frac{1}{2} ||w||^2 - \sum_{i=1}^n \alpha_i (y_i(\mathbf{wx_i} + b) - 1)
\end{equation}
$$
Note that we actually have $n$ constraints and also $n$ Lagrange Multipliers. The solution to this new function can now be found be considering $\mathcal{L}$ as a new function of more variables: $\mathcal{L}(\mathbf{w}, b, \alpha_1, ..., \alpha_n)$. That new function should be maxmized w.r.t. all $\alpha_i$ and minimized w.r.t. $\mathbf{w}$ and $b$:
$$
\begin{equation}
max_{\alpha_i \geq 0}\left( min_{\mathbf{w}, b} \ \mathcal{L} \right)
\end{equation}
$$
additionally we know that $\mathcal{L}$ must be stationary, so $\delta_{\mathbf{w}, b} \mathcal{L} = 0$ must hold.
It follows that:
$$
\begin{align}
\frac{\partial \mathcal{L}}{\partial \mathbf{w}} &= 0 \Rightarrow \sum_{i=1}^N \alpha_i y_i x_i = \mathbf{w}\\\
\frac{\partial \mathcal{L}}{\partial \mathbf{b}} &= 0 \Rightarrow \sum_{i=1}^N \alpha_i y_i = \alpha^T y = 0
\end{align}
$$
Consider eq. 5 for a second. We stated in part 1 of this post, that the only vectors which contribute to the shape of the decision boundary are the support vectors. But since $\mathbf{w}$ defines the margin, it must follow that for all non-support vectors $\alpha_i = 0$. This is an important result which will come in handy later on.
$$
\begin{equation}
\alpha_i = 0 \text{ iff } x_i \text{ is not a support vector!} \notag
\end{equation}
$$
Our goal here is to transform the original problem (eq. 1 and 2) into it's dual problem. A dual problem is a optimization problem derived from a given primal problem. It provides an alternative perspective by reformulating the problem in terms of constraints rather than variables. In case of strong duality, solving the dual problem will also solve the primal. For strong duality the Karush-Kuhn-Tucker (KKT) conditions need to hold. Working through all of these conditions is laborious but does not yield any particular insights, hence I will skip these steps here. If you apply eq. 5 and 6 to eq. 4 and take KKT into account you can derive the following dual problem:
$$
\begin{equation}
max_{\alpha_i \geq 0}\ \mathcal{L}_{dual} = max_{\alpha_i \geq 0}\ \sum_{i=1}^n \alpha_i - \frac{1}{2} \sum_{i=1}^n \sum_{j=1}^n \alpha_i \alpha_j y_i y_j x_i^T x_j
\end{equation}
$$
Note that the dual problem does no longer depend on $\mathbf{w}$ or $b$. In fact these variables can be recovered through eq. 5 and 6 once the appropriate alpha's have been found. The other great characteristic of this dual formulation is that it does not depend on $x_i$ by itself, but only on the dot product $x_i^Tx_j$ of our input feature vectors.
Enter Kernel Functions
In 1909, James Mercer introduced a theorem that has since become a cornerstone of modern machine learning and data science. This elegant mathematical insight fundamentally transformed how we approach problems involving high-dimensional feature spaces. Mercer's theorem states: The dot product of $x$ and $z$ in some higher-dimensional feature space can be represented by a symmetric and positive semi-definite function $K(x, z)$.$$
\begin{equation}
K(x,z) = \Phi(x)^T\Phi(z)
\end{equation}
$$
where $\Phi(\cdot)$ is the transformation function that maps the original input $x$ into a (potentially infinite-dimensional) feature space. However, a key advantage of this approach is that:
- The mapping function $\Phi(\cdot)$ does not need to be computed explicitly
- Instead, $K(x, z)$ directly calculates the equivalent result of the dot product $\Phi(x)^T\Phi(z)$ in the high-dimensional feature space.
Equiped with this new tool we can reconsider eq. 7. In order to map our data it into a high dimensional space, we can now replace $x_i^Tx_j$ with $\Phi(x_i^T)\Phi(x_j)$ and finally with $K(x_i, x_j)$.
$$
\begin{align}
max_{\alpha_i \geq 0}\ \mathcal{L}_{dual}
&= max_{\alpha_i \geq 0}\ \sum_{i=1}^n \alpha_i - \frac{1}{2} \sum_{i=1}^n \sum_{j=1}^n \alpha_i \alpha_j y_i y_j x_i^T x_j \notag \\\
&= max_{\alpha_i \geq 0}\ \sum_{i=1}^n \alpha_i - \frac{1}{2} \sum_{i=1}^n \sum_{j=1}^n \alpha_i \alpha_j y_i y_j \Phi(x_i^T)\Phi(x_j) \notag \\\
&= max_{\alpha_i \geq 0}\ \sum_{i=1}^n \alpha_i - \frac{1}{2} \sum_{i=1}^n \sum_{j=1}^n \alpha_i \alpha_j y_i y_j K(x_i, x_j) \notag
\end{align}
$$
Although it looks involved recall that $\alpha_i \neq 0$ only for support vectors. Hence most of the terms in that double sum will vanish. Thus we can replace each summation up to $n$ with a sum only over support vectors.
$$
\begin{equation}
max_{\alpha_i \geq 0}\ \mathcal{L}_{dual} = max_{\alpha_i \geq 0}\ \sum_{SV_i} \alpha_i - \frac{1}{2} \sum_{(SV_i, SV_j)} \alpha_i \alpha_j y_i y_j K(x_i, x_j)
\end{equation}
$$
As we see explicitly mapping our feature vectors into a new space is equivalent to replacing the transformations with a certain Kernel function.
The Kernel essentially determines the space in which the solution is seeked - the space $\Phi(\cdot)$ would have mapped to. The Gaussian Kernel aka. *Gaussian Radial Basis Function* (RBF), is one of the most popular and powerful Kernels, since it corresponds to a mapping into an infinite-dimensional space - I know it's crazy. RBF is given by:
$$
\begin{equation}
K(x,z) = exp \left( - \frac{||x-z||^2}{2 \sigma^2} \right)
\end{equation}
$$
Here $||x-z||^2$ represents the Euclidean distance of the vectors $x$ and $z$ and $\sigma$ denotes the spread parameter which plays the same role as the standard deviation in a normal distribution function. When $\sigma$ is large the RBF Kernel becomes flat, which allows even far apart data points to influence each other leading to a smoother decision boundary. A small $\sigma$ results in a more complex decision boundary. Finally before we look into the implementation, recall that the decision function of the SVM is defined as:
$$
\begin{equation}
f(x) = \mathbf{w}x + b \notag
\end{equation}
$$
The sign function from part 1 has been neglected, since we are not only interested in the category, but also the confidence of the decision. We can update the decision function in the dual formalism by plugging in $\mathbf{w}$ from eq. 5:
$$
\begin{align}
f(x)
&= \sum_{i=1}^n \alpha_i y_i x_i^T x + b \notag \\\
&= \sum_{SV_i} \alpha_i y_i K(x_i, x) + b
\end{align}
$$
Again we made use of the fact, that $\alpha_i \neq 0$ only for support vectors.
Solving the objective function
The final objective function we wish to maximize is:$$
\begin{equation}
max_{\alpha_i \geq 0}\ \mathcal{L}_{dual}
= max_{\alpha_i \geq 0}\ \left( \sum_{SV_i} \alpha_i - \frac{1}{2} \sum_{(SV_i, SV_j)} \alpha_i \alpha_j y_i y_j \ exp \left( - \frac{||x_i-x_j||^2}{2 \sigma^2} \right) \right)
\end{equation}
$$
We can now efficiently compute a solution using the *scipy optimizer* for example. Since *scipy* only provides a *minimize* function we need to swap the sign of the argument. Maximizing some term is equivalent to minimizing it's negative.
$$
\begin{equation}
max_{\alpha_i \geq 0}\ \mathcal{L}_{dual}
= min_{\alpha_i \geq 0}\ \left( \frac{1}{2} \sum_{(SV_i, SV_j)} \alpha_i \alpha_j y_i y_j \ exp \left( - \frac{||x_i-x_j||^2}{2 \sigma^2} \right) - \sum_{SV_i} \alpha_i\right)
\end{equation}
$$
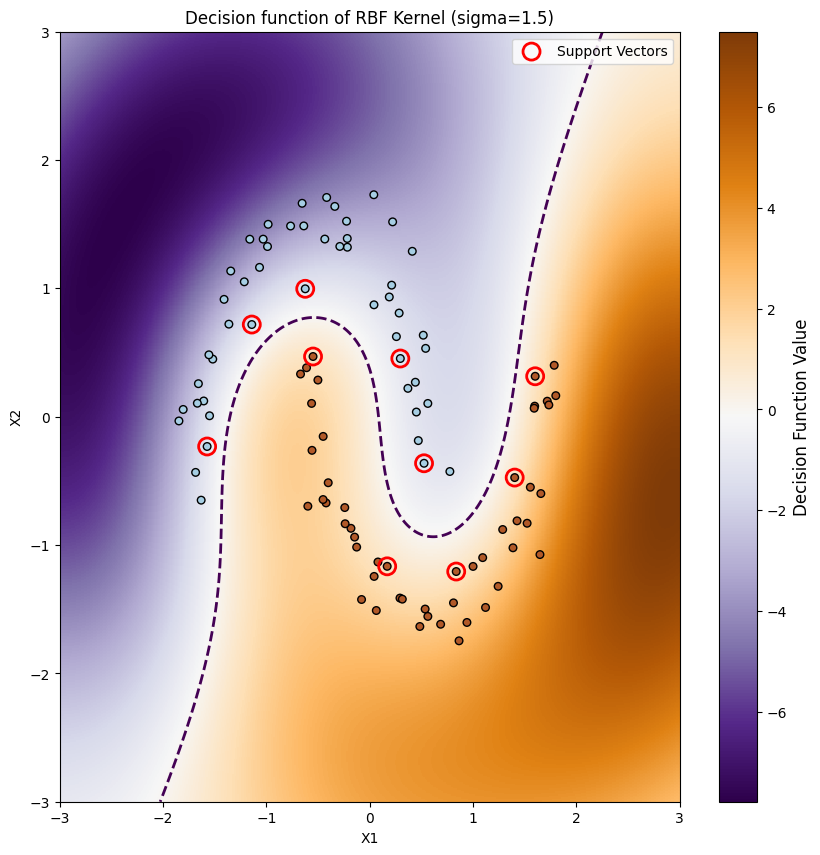
Remember the moon-dataset shown in part 1? Let's try to find a decision boundary using the RBF Kernel. Just like in the first part we start by loading and preprocessing the data. It is important to mention that SVMs classifiers are sensitive to the scale of the features. If the features are not of the same scale, the optimization of the margin will be biased toward the largest feature. Therefore it is important to standardize your data before training the model.
import numpy as np
from sklearn.datasets import make_moons
from sklearn.preprocessing import StandardScaler
from sklearn.metrics.pairwise import rbf_kernel
from scipy.optimize import minimize

scaler = StandardScaler()

def load_data():
    X, y = make_moons(n_samples=100, noise=0.1, random_state=42)
    # standardize the data
    X = scaler.fit_transform(X)
    # use -1 and 1 as categories (not 0 and 1)
    custom_mapping = {0: -1, 1: +1}
    y = np.array([custom_mapping[label] for label in y])
    return X, y
def make_L_dual(K):
    """Set the Kernel 'K' and return the L_dual function"""
    def L_dual(alpha):
        """The dual objective function to minimze for SVM.
        K represents the Kernel function
        """
        # calculate the terms in eq. 11:
        first_term = 0.5  np.sum(np.outer(alpha, alpha)  np.outer(y, y)  K)
        second_term = np.sum(alpha)
        return first_term - second_term
    return L_dual

def L_dual_grad(alpha):
    """The gradient of the dual objective function.
    """
    grad = np.dot(np.outer(y, y)  K, alpha) - np.ones_like(alpha)
    return grad
if __name__ == "__main__":
    X, y =  load_data()

    # Sigma tunes the smoothness of the decision boundary:
    sigma = 1.5
    K = rbf_kernel(X, X, gamma=1/(2sigma2))
    L_dual = make_L_dual(K)

    # alpha >= 0 (KKT constraint):
    constraints = ({'type': 'ineq', 'fun': lambda alpha: alpha})
    initial_alpha = np.zeros(X.shape[0])

    result = minimize(
        fun=L_dual,
        x0=initial_alpha,
        jac=L_dual_grad,
        constraints=constraints,
        method='SLSQP'
    )

    # get the alphas which solve L_dual:
    alphas = result.x

    # identify support vectors, use 1e-5 as threshold for numerical stability:
    sv = alphas > 1e-5
    alphas_sv = alphas[sv]
    X_sv = X[sv]
    y_sv = y[sv]
    print("Number of support vectors:", len(alphas_sv))

    # Compute the bias b for each support vector and take the mean
    b = np.mean(y_sv - np.dot(K[sv, :], alphas  y))
    print("Bias b:", b)

    plot_decision_boundary(alphas_sv, X_sv, y_sv, b, sigma)
def plot_decision_boundary(alphas_sv, X_sv, y_sv, b, sigma):
    xx, yy = np.meshgrid(np.linspace(-3, 3, 500), np.linspace(-3, 3, 500))
    grid_points = np.c_[xx.ravel(), yy.ravel()]
    grid_points = scaler.transform(grid_points)

    # Compute the decision function according to eq. 11:
    decision_function = lambda x: np.dot(rbf_kernel(x, X_sv, gamma=1/(2  sigma2)), alphas_sv  y_sv) + b

    Z = decision_function(np.c_[xx.ravel(), yy.ravel()])
    Z = Z.reshape(xx.shape)
    plt.figure(figsize=(10,10))
    heatmap = plt.imshow(
        Z,
        interpolation="nearest",
        extent=(xx.min(), xx.max(), yy.min(), yy.max()),
        aspect="auto",
        origin="lower",
        cmap=plt.cm.PuOr_r,
    )
    # Add colorbar as a legend for the heatmap
    cbar = plt.colorbar(heatmap)
    cbar.set_label("Decision Function Value", fontsize=12)

    # Plot the decision boundary
    contours = plt.contour(xx, yy, Z, levels=[0], linewidths=2, linestyles="dashed")
    # and the data points
    plt.scatter(X[:, 0], X[:, 1], s=30, c=y, cmap=plt.cm.Paired, edgecolors="k")
    # highlight support vectors:
    plt.scatter(
        X_sv[:, 0], X_sv[:, 1],
        facecolors='none', edgecolors='red',
        s=150, label='Support Vectors', linewidths=2
    )
    plt.legend()
    plt.axis([-3, 3, -3, 3])
    plt.title(f"Decision function of RBF Kernel (sigma={sigma:.1f})")
    plt.xlabel('X1')
    plt.ylabel('X2')
    plt.show()

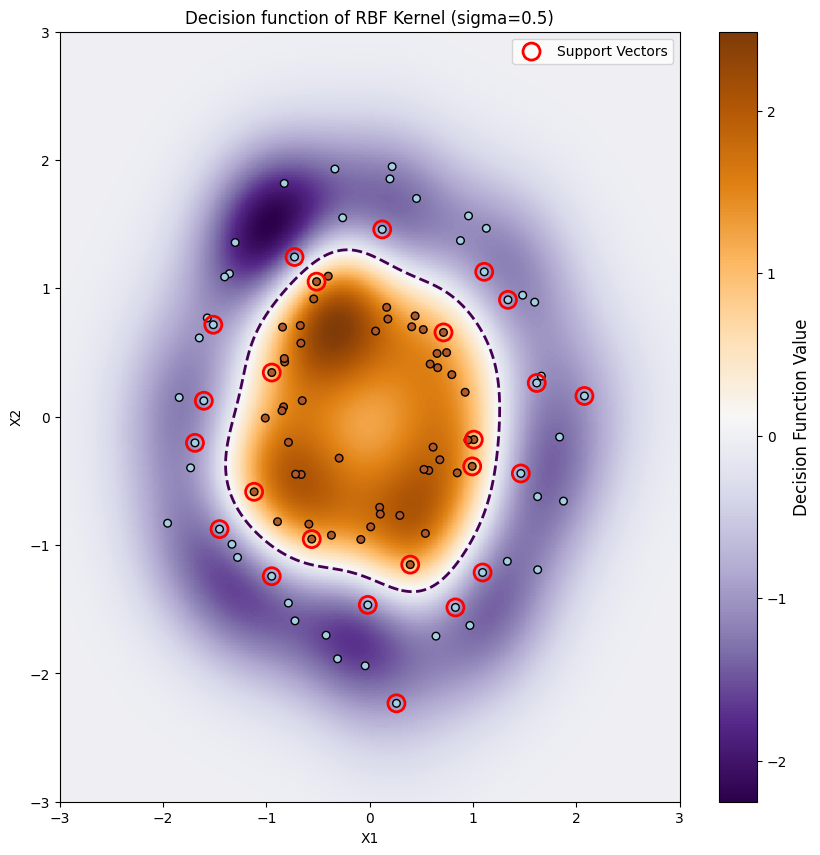
As we can see we get a curved decision boundary, which nicely separates the data. We can now make the same thing for the circular dataset shown at the beginning of the post.

To account for the proximity of the data points, we reduce $\sigma$ to 0.5. This adjustment reduces the influence of distant data points on the boundary, enabling it to adapt more quickly. As a result, the decision boundary becomes less smooth, better reflecting the tighter clustering of the data.
Validation using Scikit-Learn
Our implementation of the SVM algorithm is intended primarily for educational purposes. For practical use, Python's Scikit-Learn library provides a more efficient and easy to use interface for SVMs. In this final section, we’ll explore how to use Scikit-Learn’s implementation and use it to cross-check our results, gaining a bit more confidence in the outcomes.import numpy as np
from sklearn.svm import SVC
from sklearn.preprocessing import StandardScaler
from sklearn.datasets import make_moons
from sklearn.pipeline import Pipeline
X, y = make_moons(noise=0.1, random_state=0)
poly_kernel_svm_clf = Pipeline([
("scaler", StandardScaler()),
("svm_clf", SVC(kernel="poly", degree=3, coef0=1, C=5))
])
poly_kernel_svm_clf.fit(X, y)
plot_decision_boundary(poly_kernel_svm_clf, "")
def plot_decision_boundary(model ,title):
    xx, yy = np.meshgrid(np.linspace(-3, 3, 500), np.linspace(-3, 3, 500))

    Z = model.decision_function(np.c_[xx.ravel(), yy.ravel()])
    Z = Z.reshape(xx.shape)
    plt.figure(figsize=(10,10))
    plt.imshow(
        Z,
        interpolation="nearest",
        extent=(xx.min(), xx.max(), yy.min(), yy.max()),
        aspect="auto",
        origin="lower",
        cmap=plt.cm.PuOr_r,
    )

    contours = plt.contour(xx, yy, Z, levels=[0], linewidths=2, linestyles="dashed")
    plt.scatter(X[:, 0], X[:, 1], s=30, c=y, cmap=plt.cm.Paired, edgecolors="k")
    plt.axis([-3, 3, -3, 3])
    plt.title(title)
    plt.xlabel('X1')
    plt.ylabel('X2')
    plt.show()